When quantity
matters!
Sccanoo is an innovative system monitoring the pedestrian and cyclist traffic density in various locations, enabling precise real-time data analysis on an online platform.
Step 01
Selecting the Location for Traffic Density Measurements
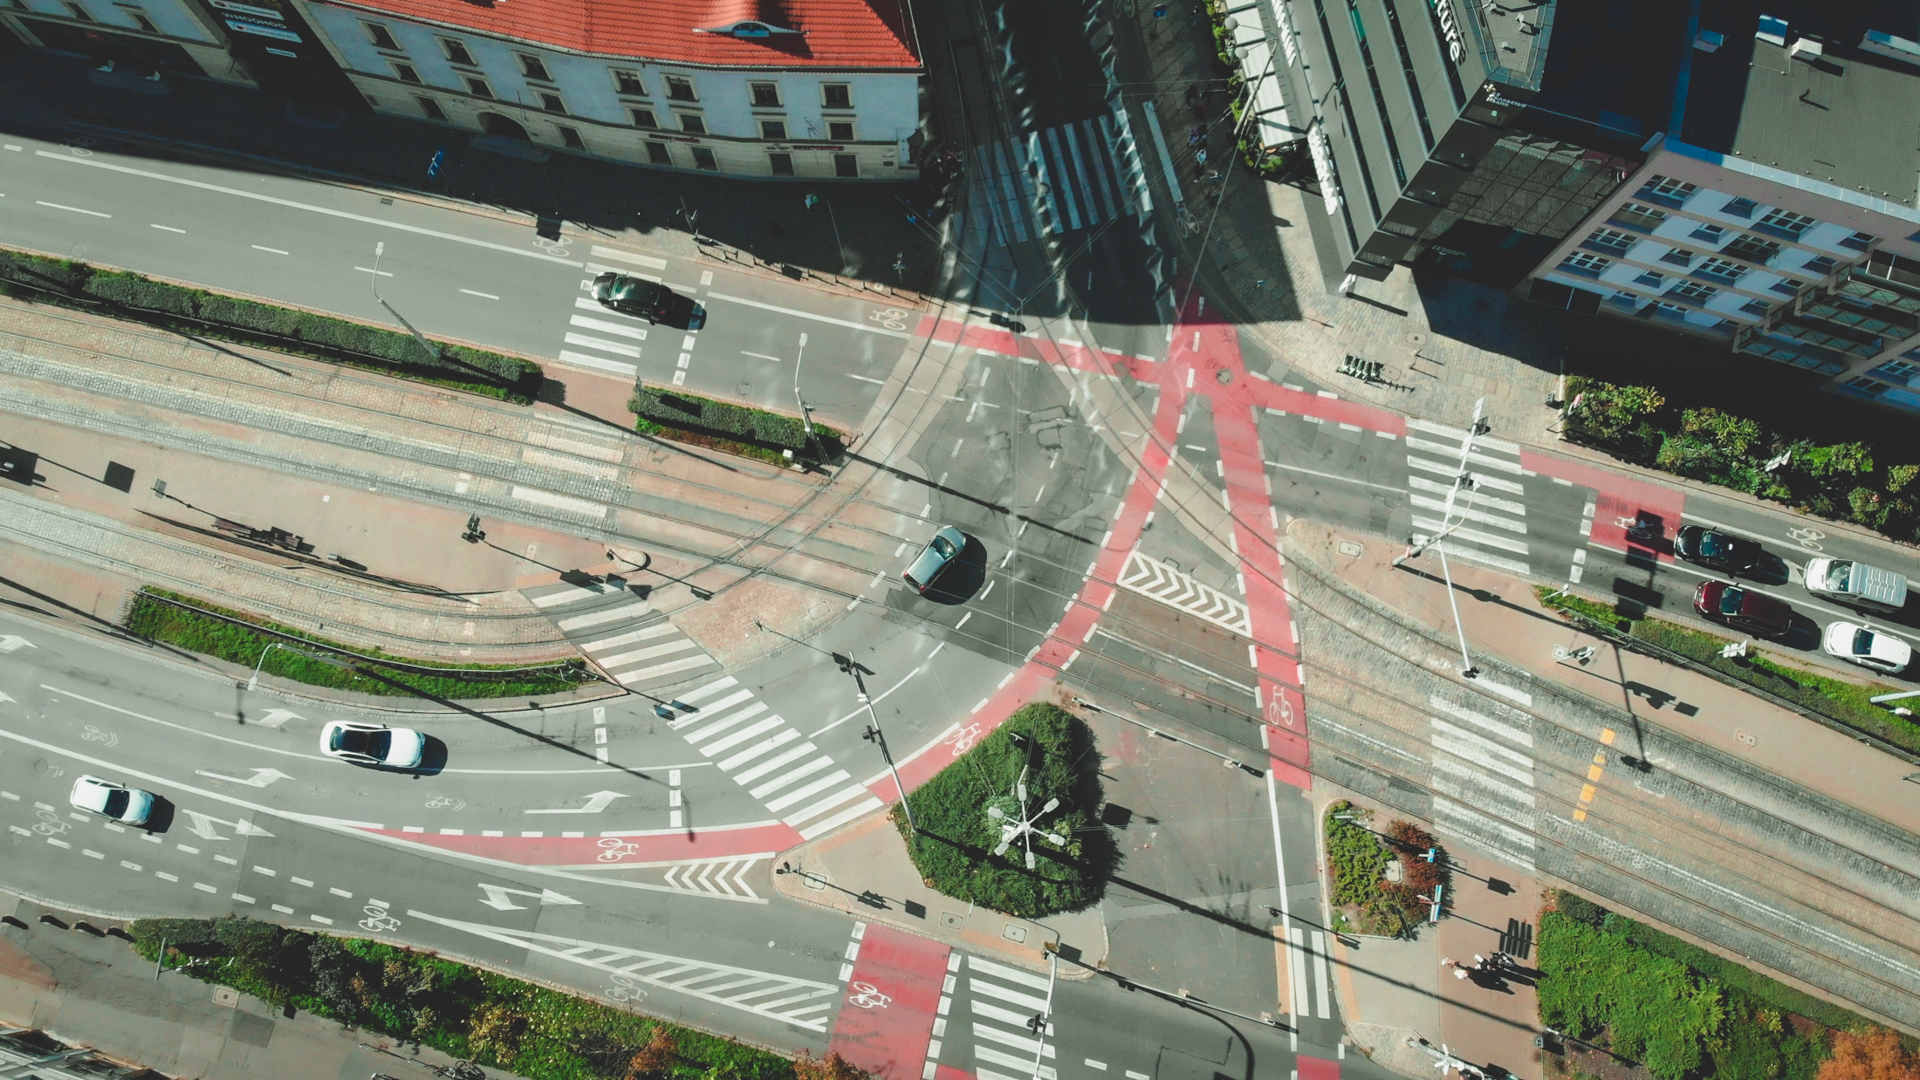
The location for SCCANOO measurements should be chosen on roads, bike paths, intersections, or other strategic points with significant pedestrian and cyclist traffic. It is best if the location has good access to daylight, appropriate visibility, and minimal obstacles that could disrupt measurement accuracy.
For SCCANOO.PIR, it's important to place it within the range of a mobile network and on a route where pedestrian or cyclist traffic occurs. In the case of SCCANOO.COM, in addition to mobile network coverage, access to a power source should also be ensured.
Step 02
Installation of Counters in Selected Locations
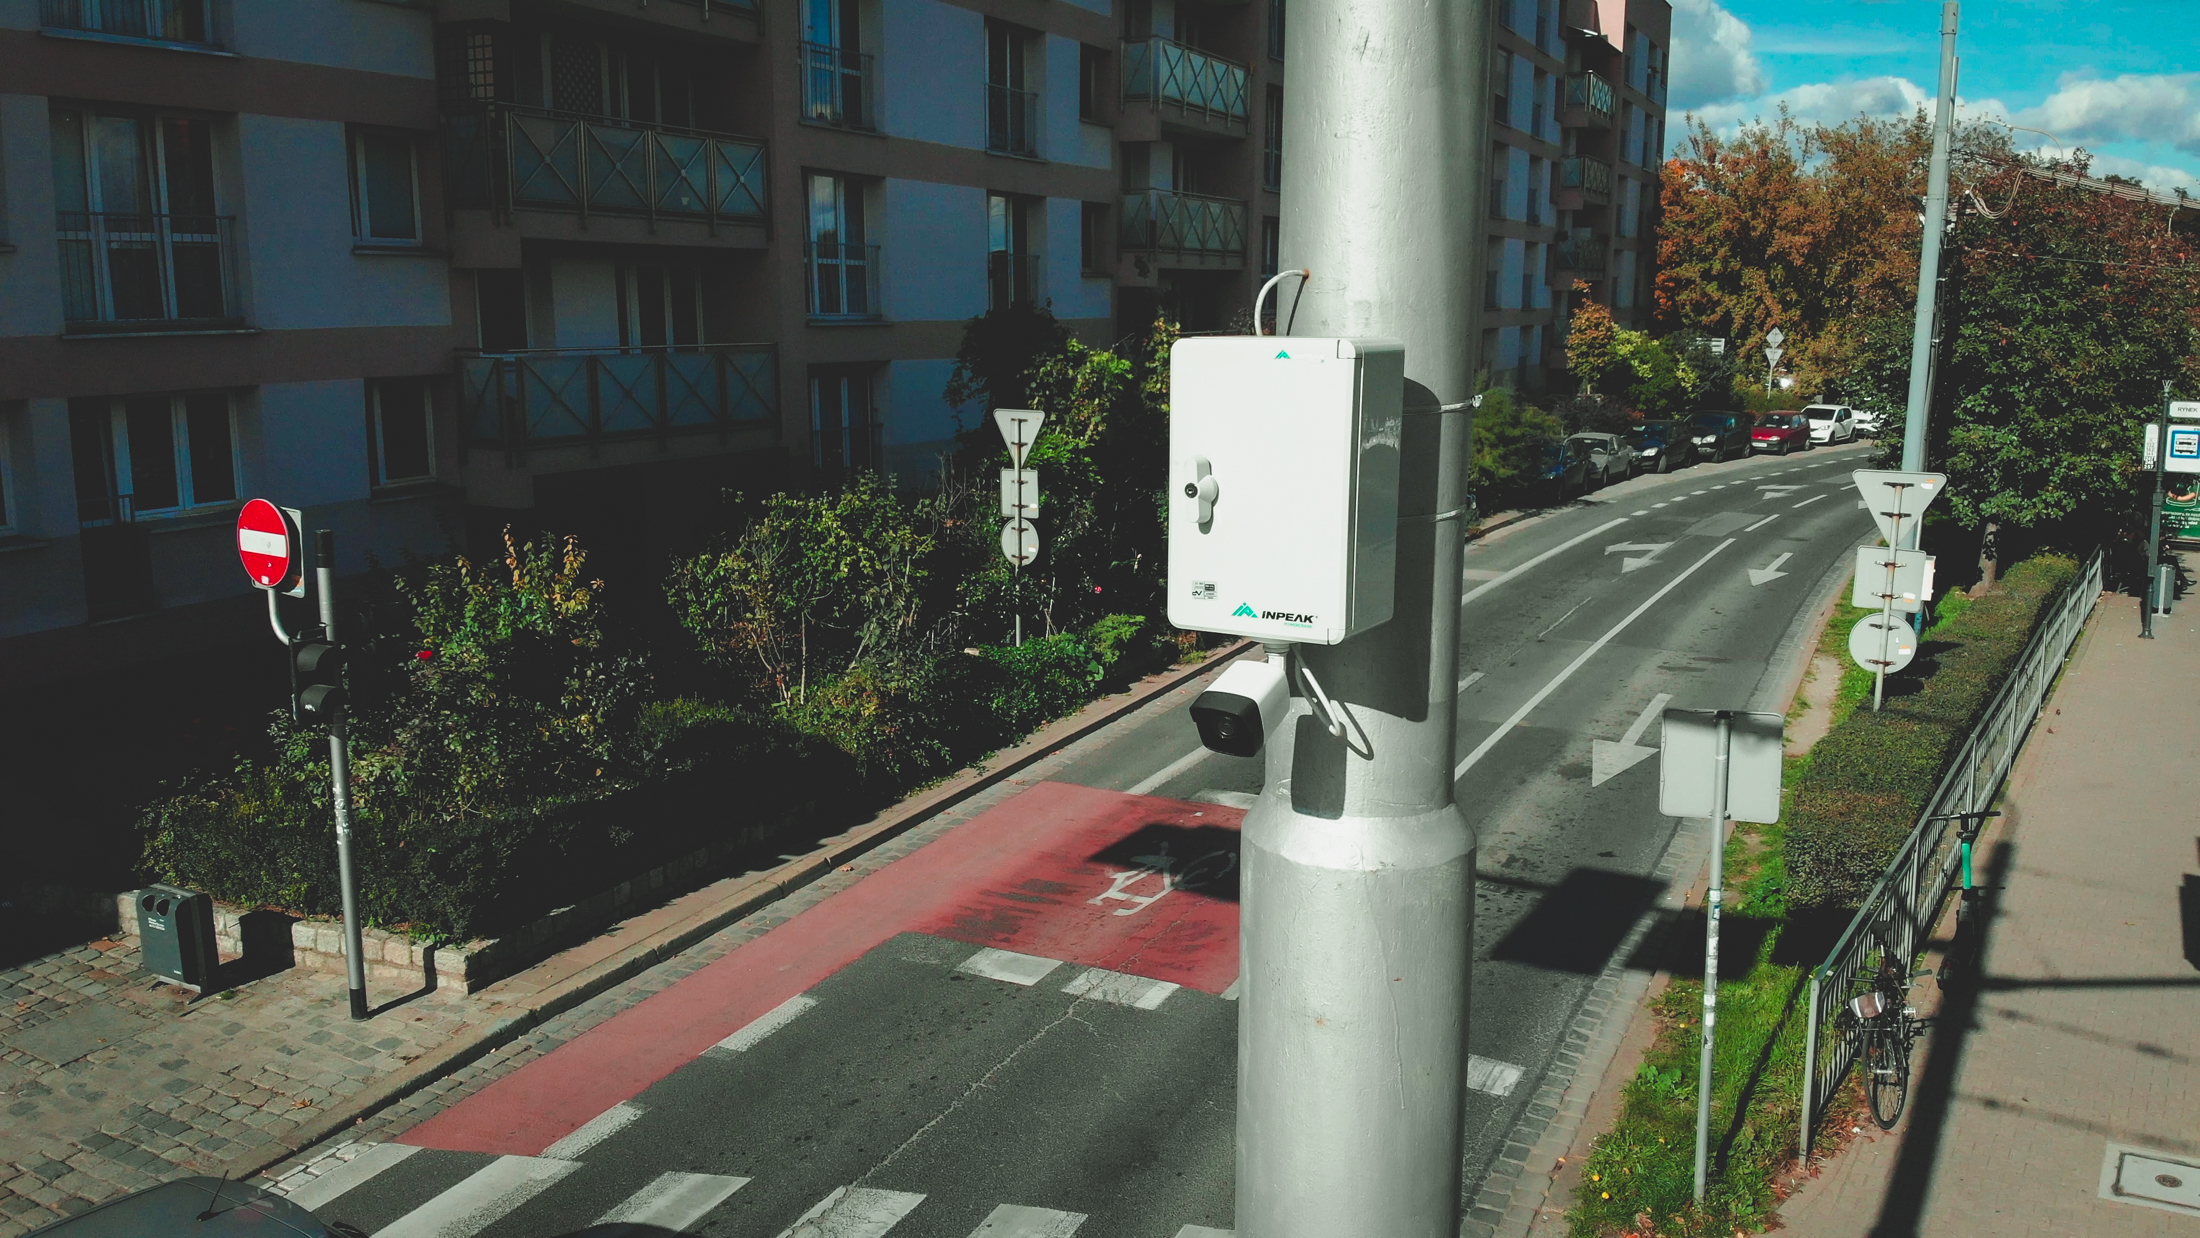
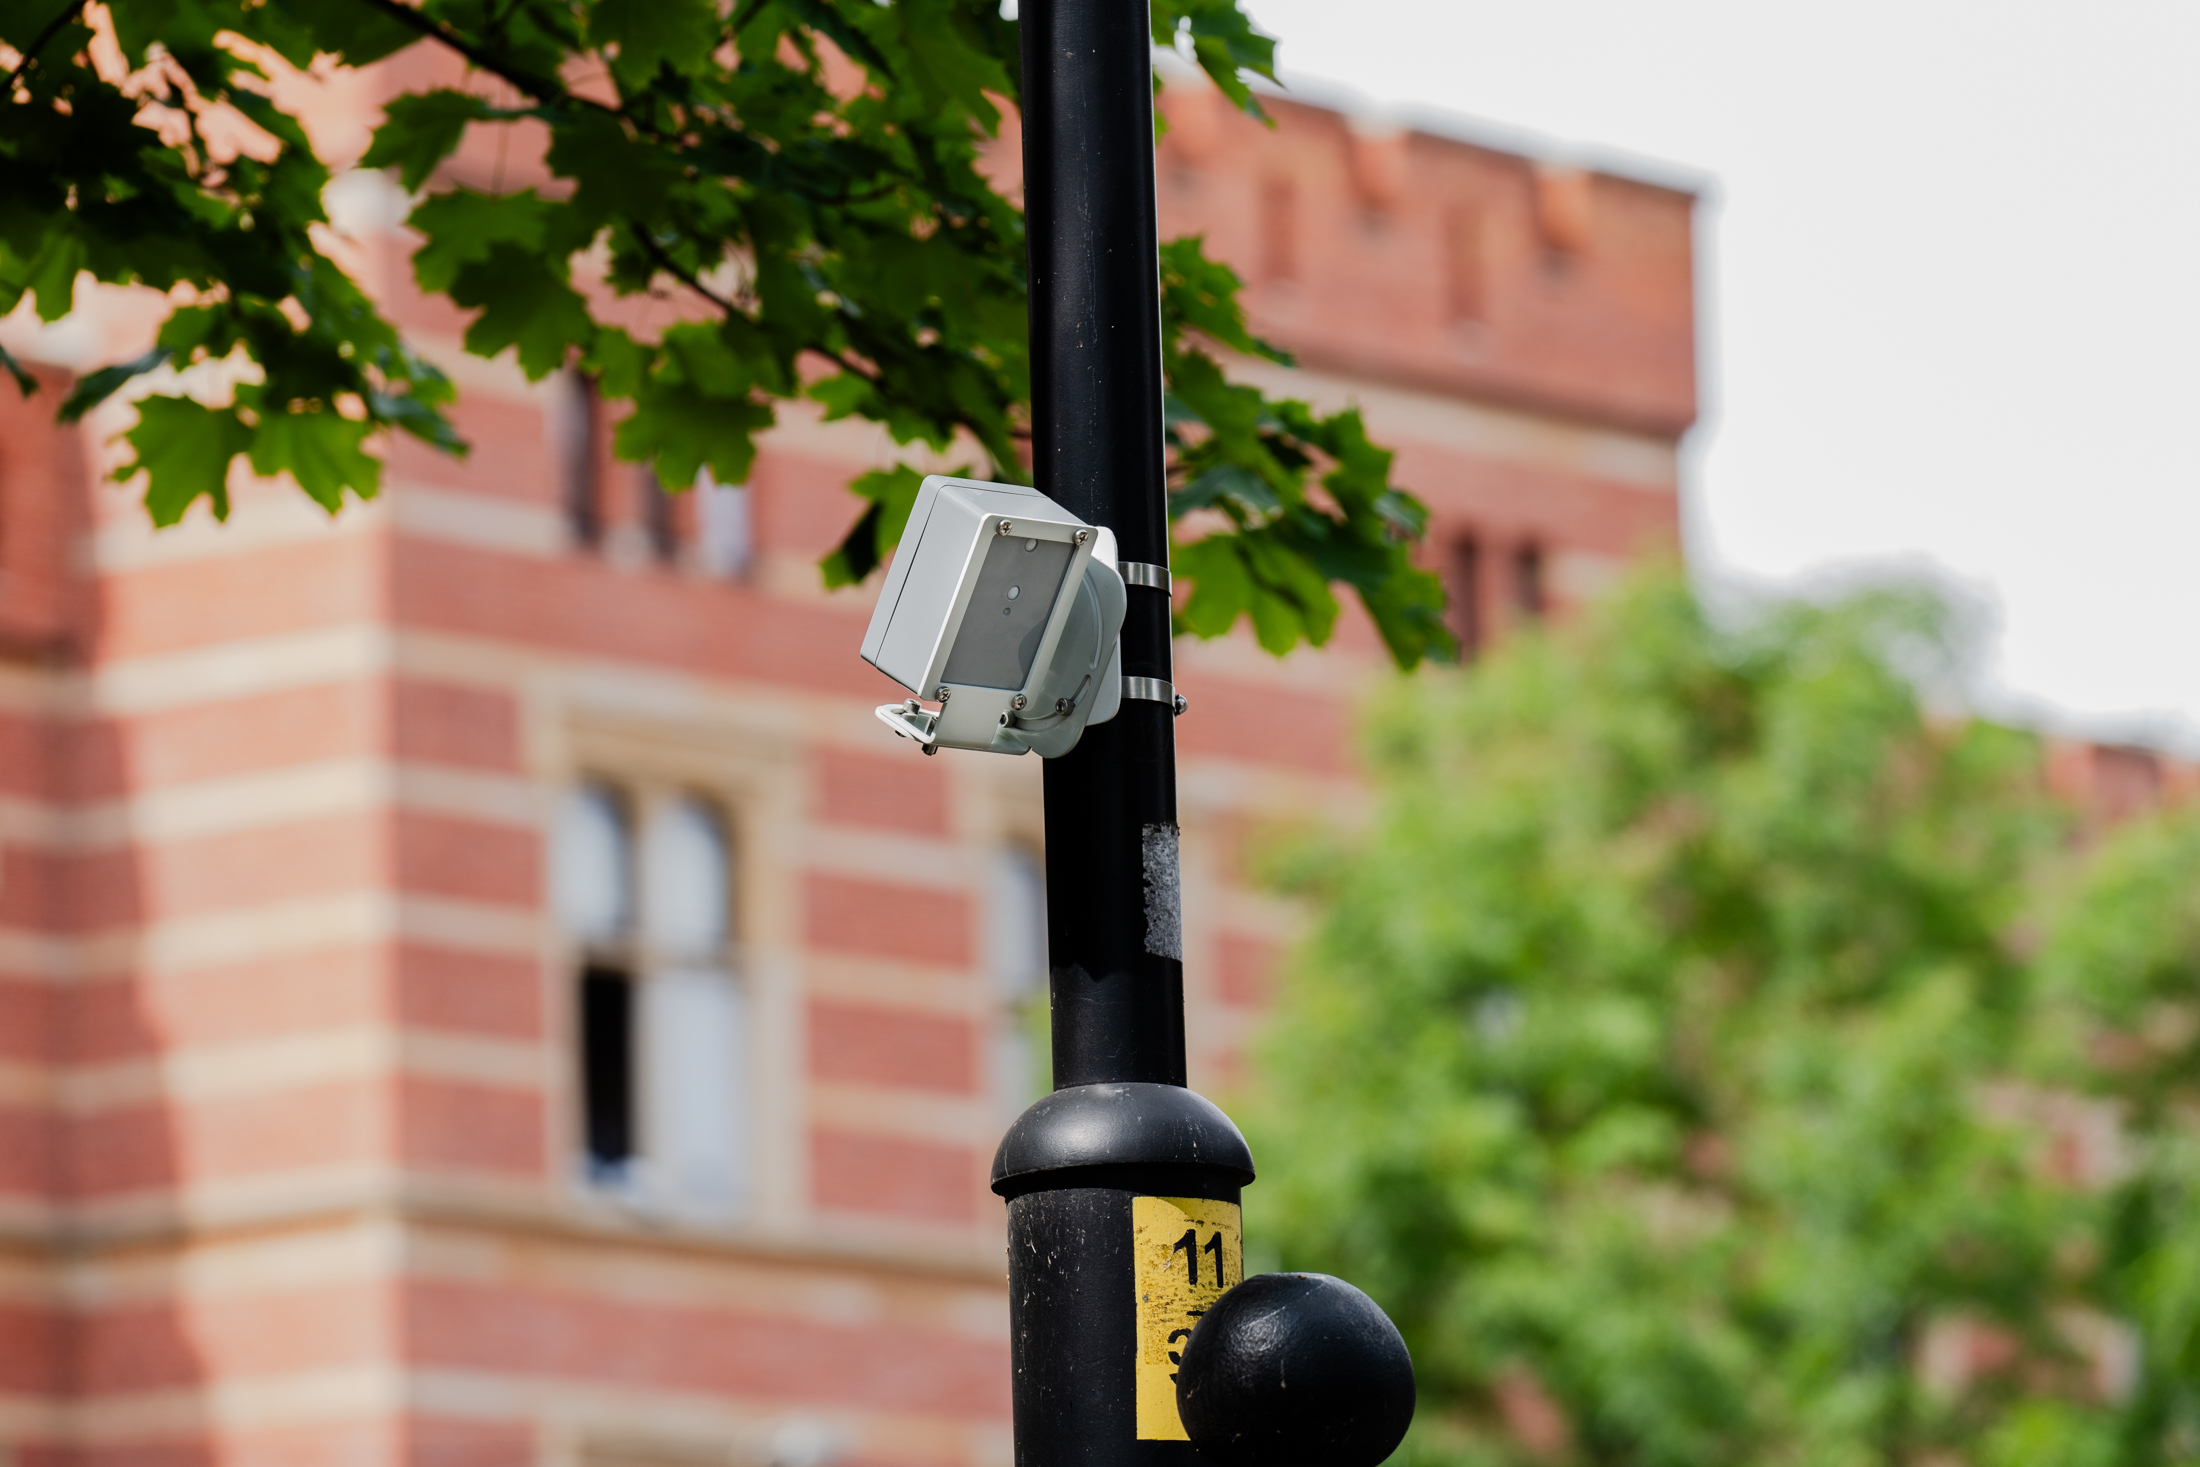
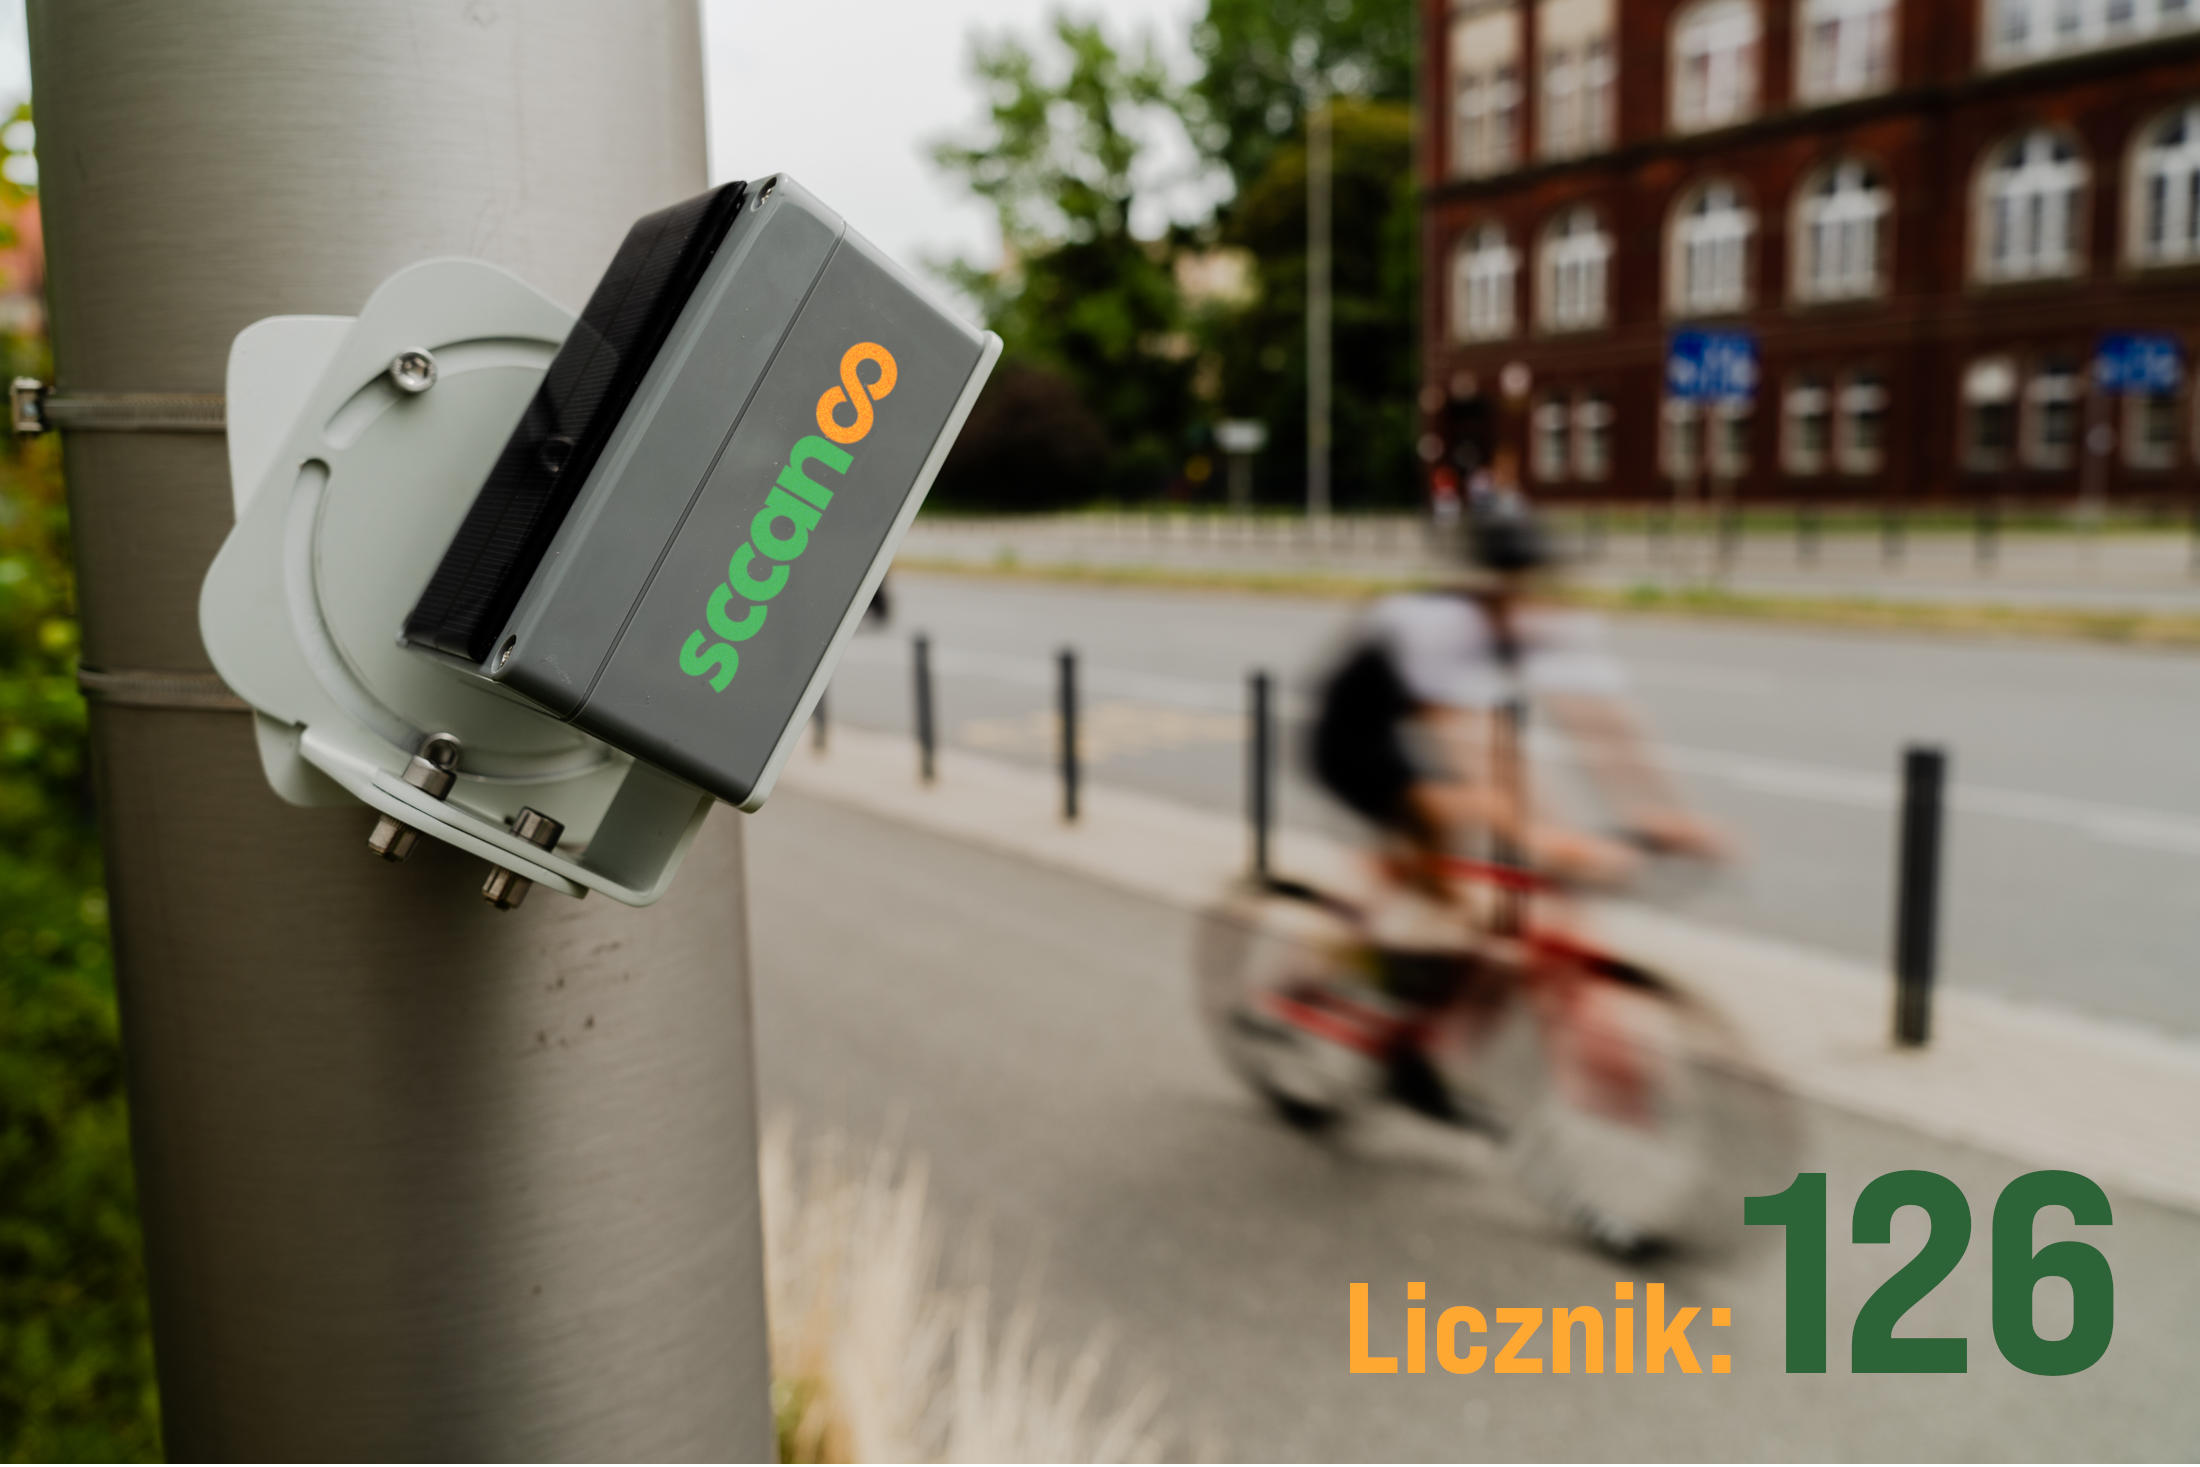
After choosing the appropriate location, the SCCANOO counter can be mounted on existing urban infrastructure, such as streetlights, posts, gates, fences, etc.
Once installed, the SCCANOO.PIR counter is ready to operate immediately, while the SCCANOO.CAM counter needs to be configured for the appropriate measurement mode and classification of counted objects (pedestrians, cyclists, scooters, etc.). These parameters can be adjusted to meet the client's individual needs and local conditions.
Step 03
Operation of SCCANOO counters and Data Observation on the Internet Platform
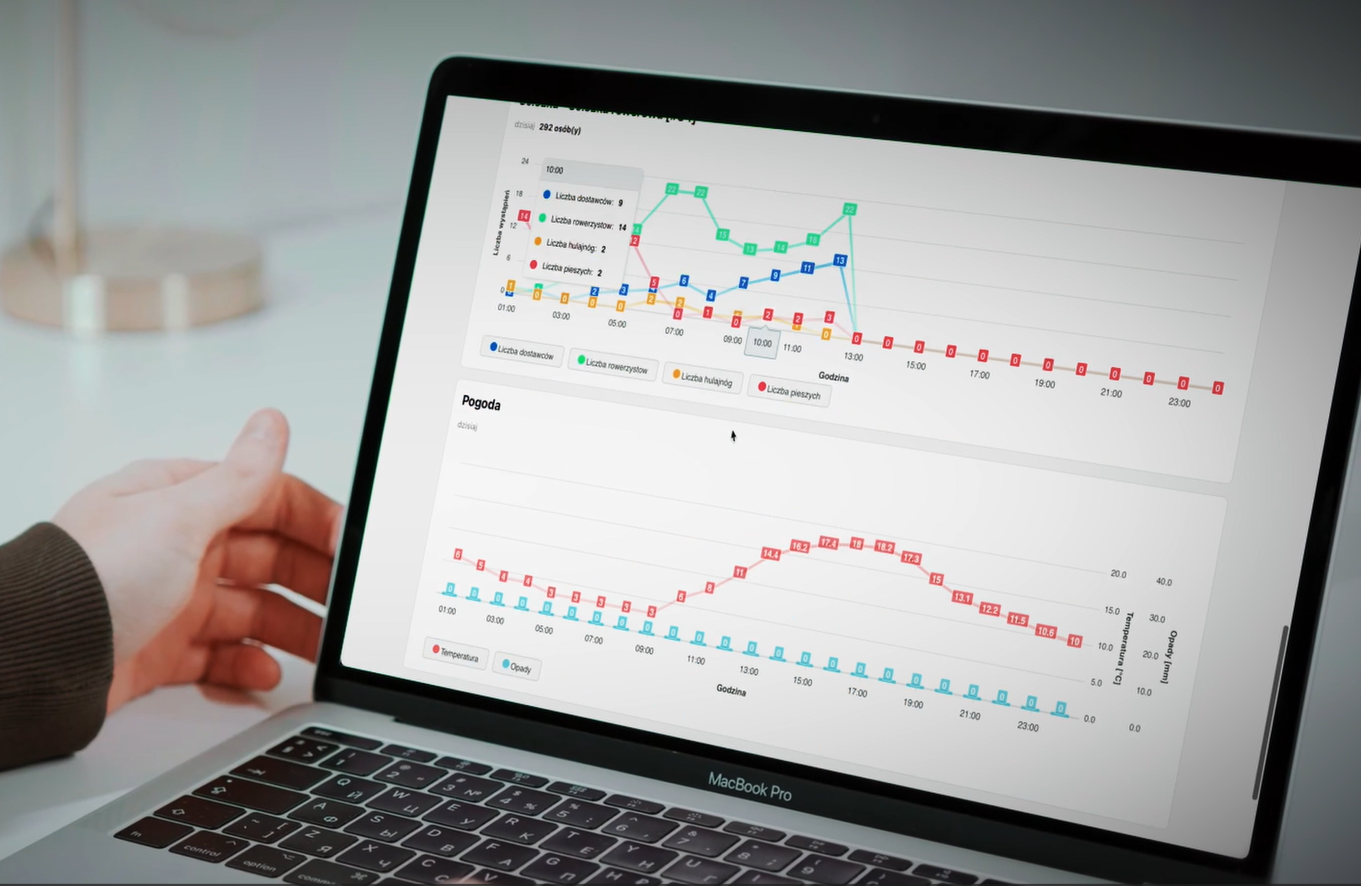
Data collected by SCCANOO devices are transmitted in real-time to the app.sccanoo.com platform.
The platform offers interactive statistics in the form of charts and maps, enabling a better understanding of traffic in a specific area or an entire region.
Additionally, weather data is integrated with traffic data, allowing for an analysis of how weather conditions impact pedestrian and cyclist traffic.
Step 04
Downloading Traffic Statistics Reports for a Selected Period from a Specific Counter
Within the SCCANOO system, it is possible to download statistics related to pedestrian and cyclist traffic. The SCCANOO platform enables generation of various reports and analyses based on collected data, such as:
-
Traffic density statistics: The number of pedestrians and cyclists recorded at a specific time in a given point or area.
-
Traffic classification statistics: The number of pedestrians, cyclists, scooters, food delivery providers, etc., counted in specific categories.
-
Traffic trends: An analysis of changes in traffic density over different time periods, such as hours, days of the week, months, or seasons.
-
Impact of weather conditions: An analysis of how changing weather conditions can affect pedestrian and cyclist traffic.
-
Historical data: The ability to download data from previous time periods for comparison and long-term analysis.
SCCANOO.PIR
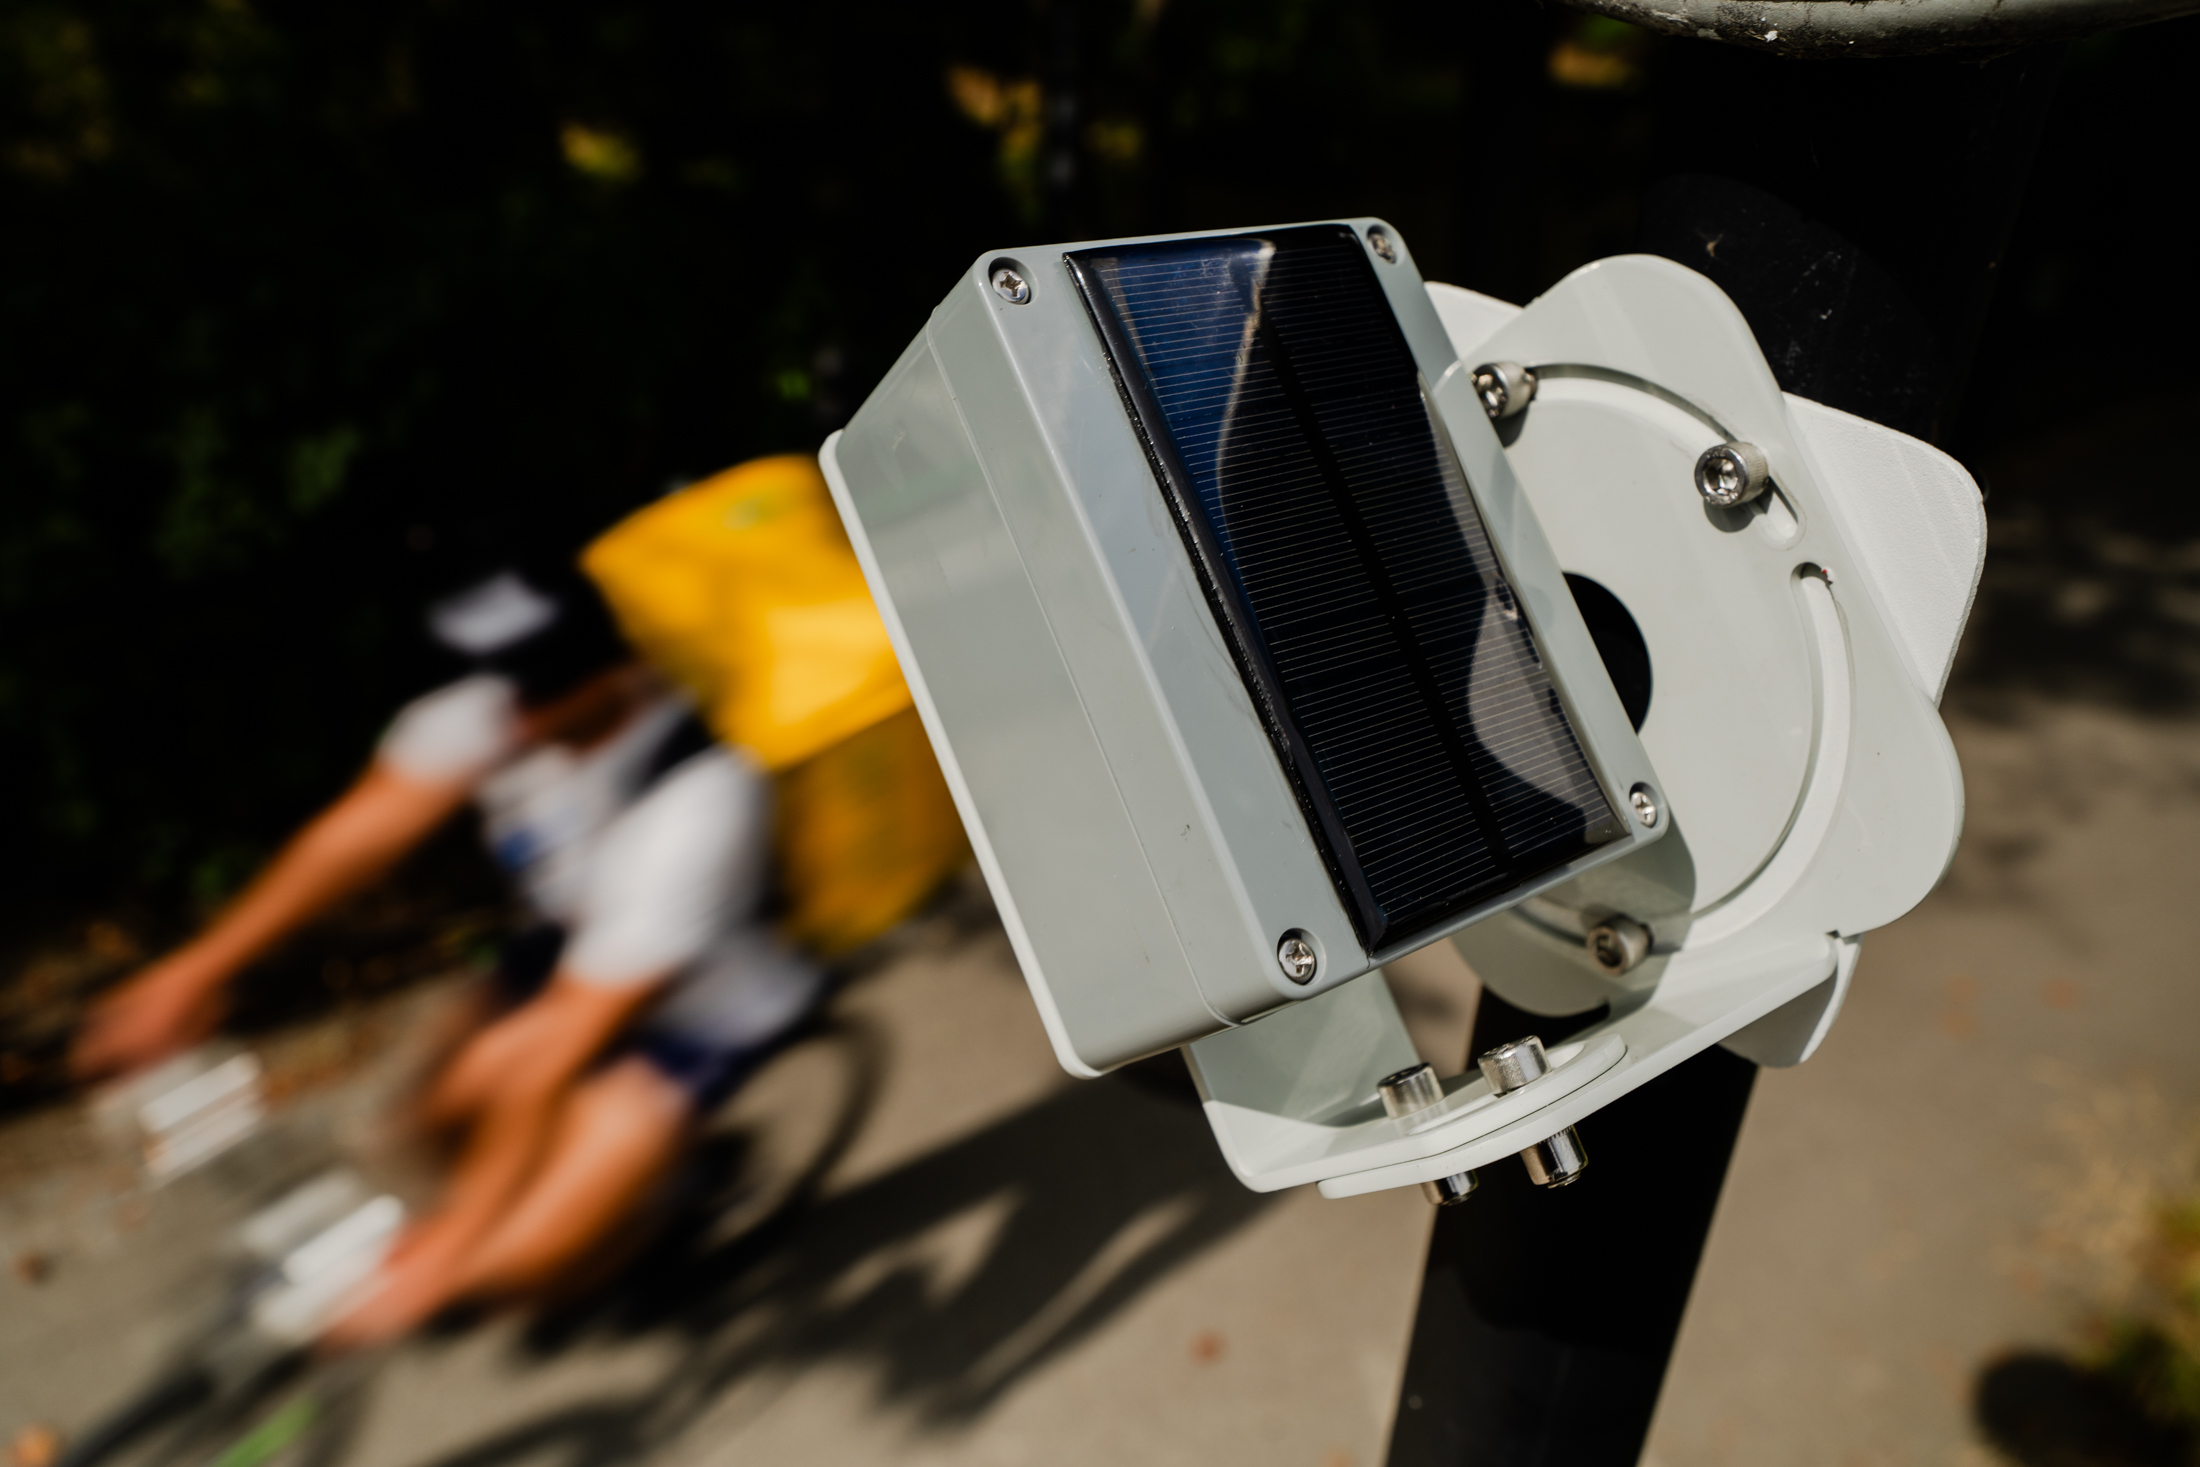
SCCANOO.PIR utilizes advanced motion detection technology in the form of infrared technology to accurately count pedestrians and cyclists passing by the sensor. With its built-in solar panel and battery, the device operates independently, without the need for an external power source.
Where can SCCANOO.PIR be applied? SCCANOO.PIR is well-suited for various locations, such as:
-> Bike paths
-> Sidewalks and pedestrian pathways
-> Intersections
-> Recreational areas and parks
-> Residential neighbourhoods
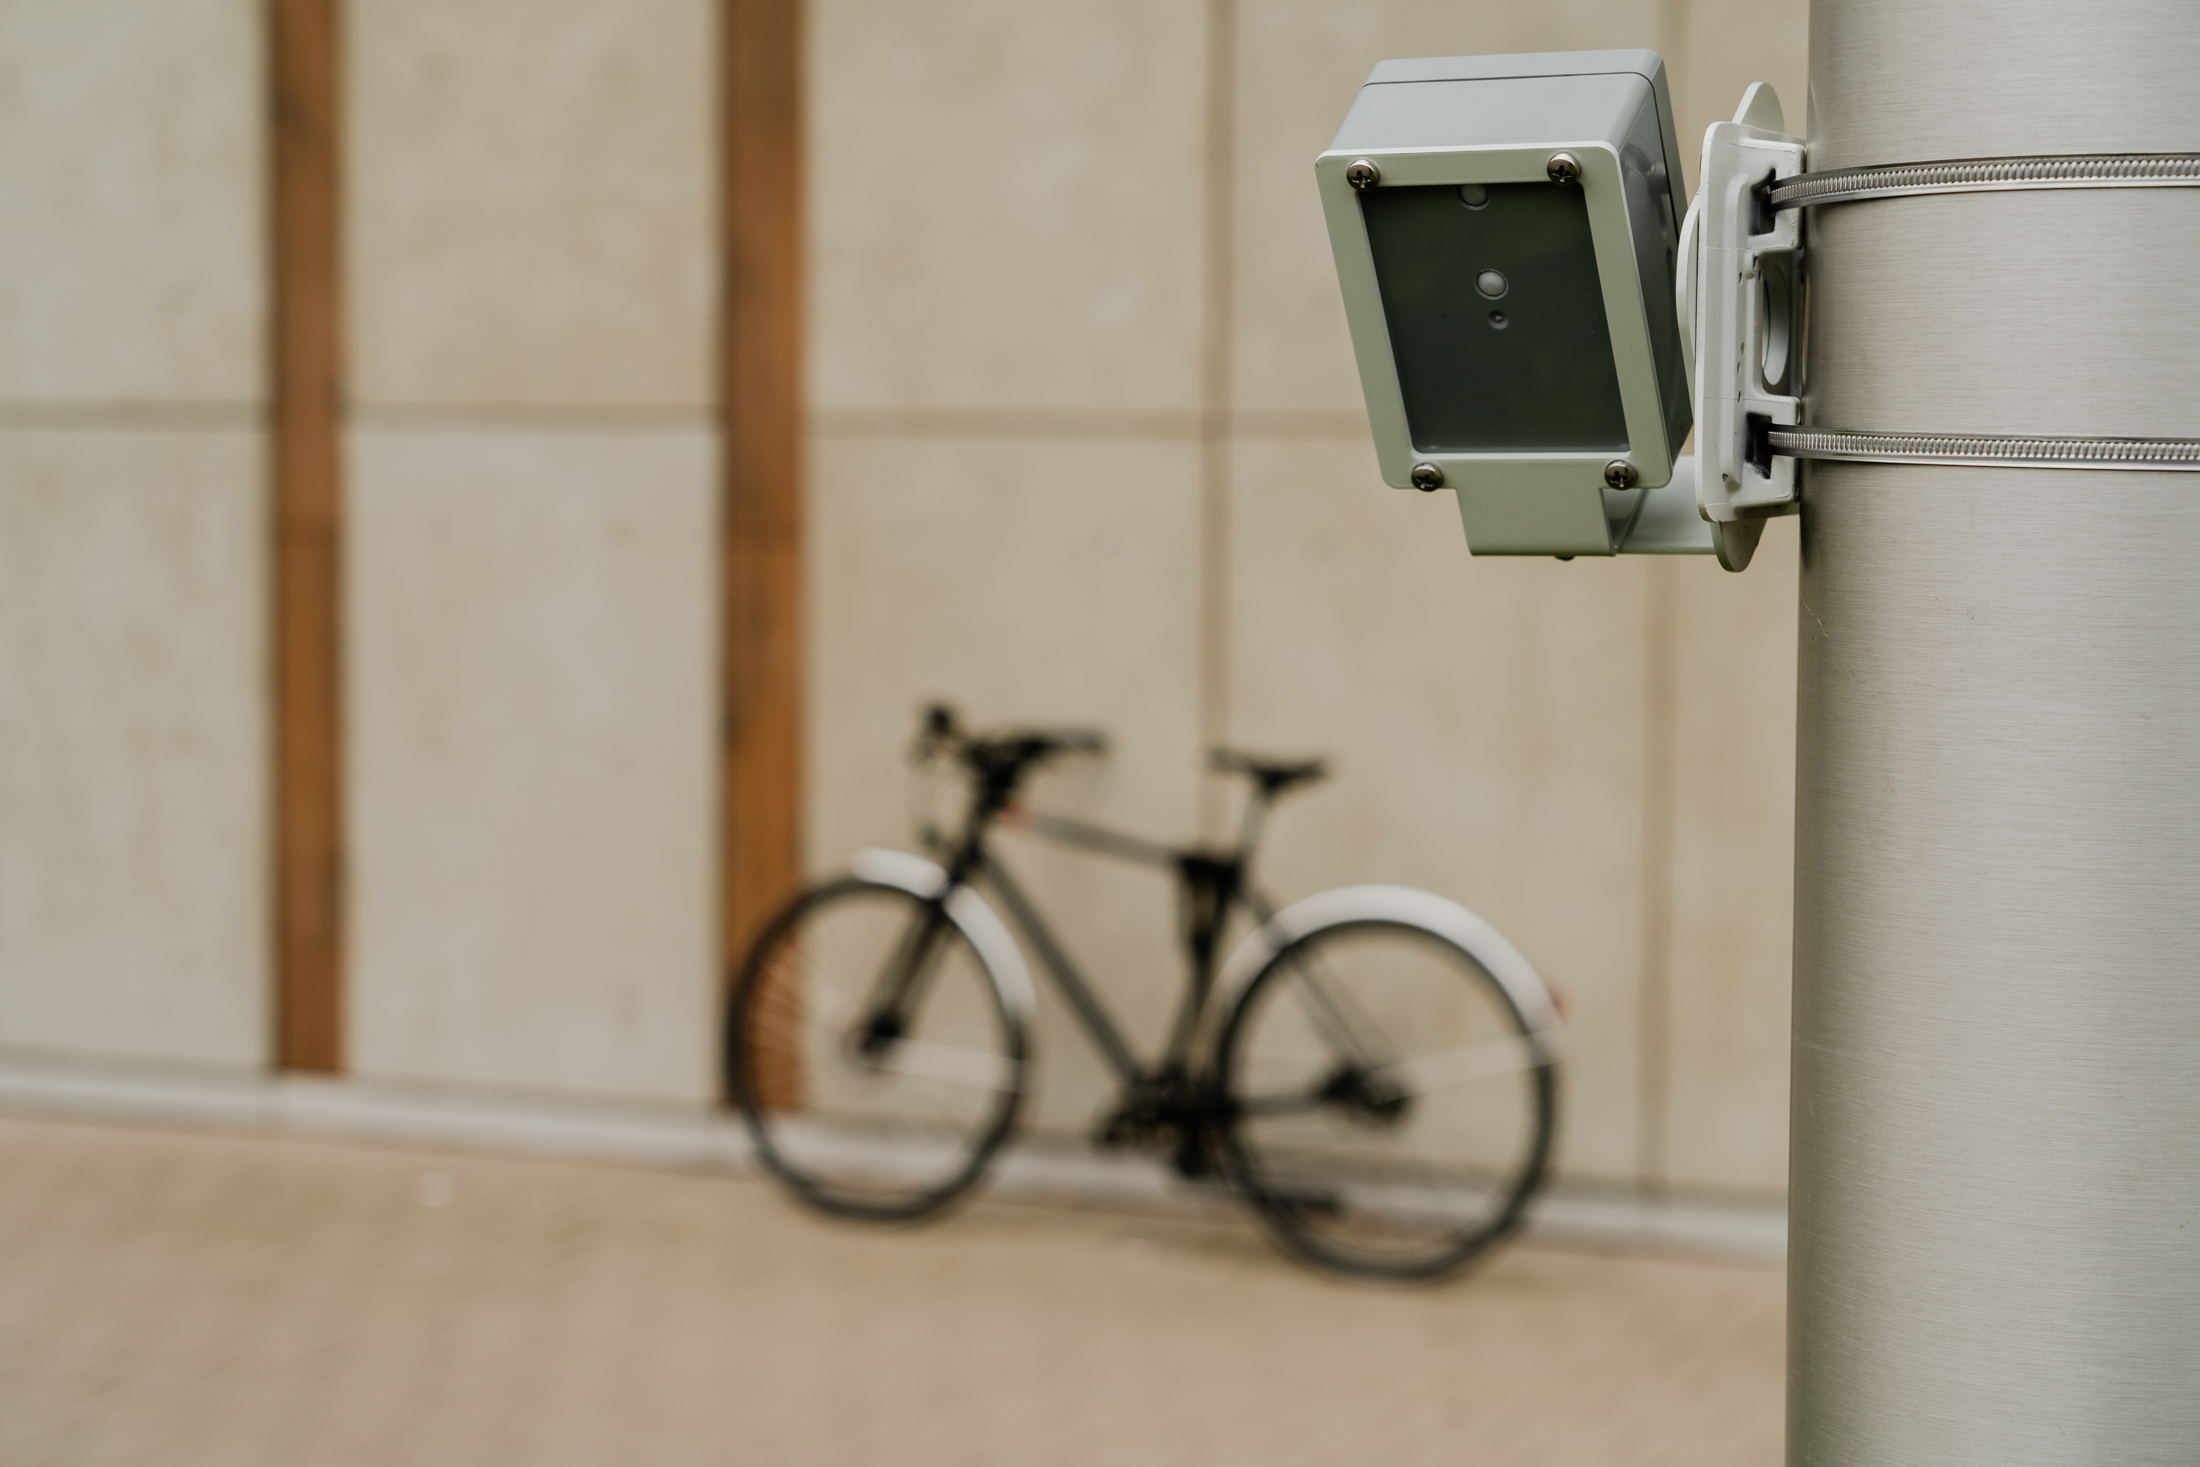
SCCANOO.CAM
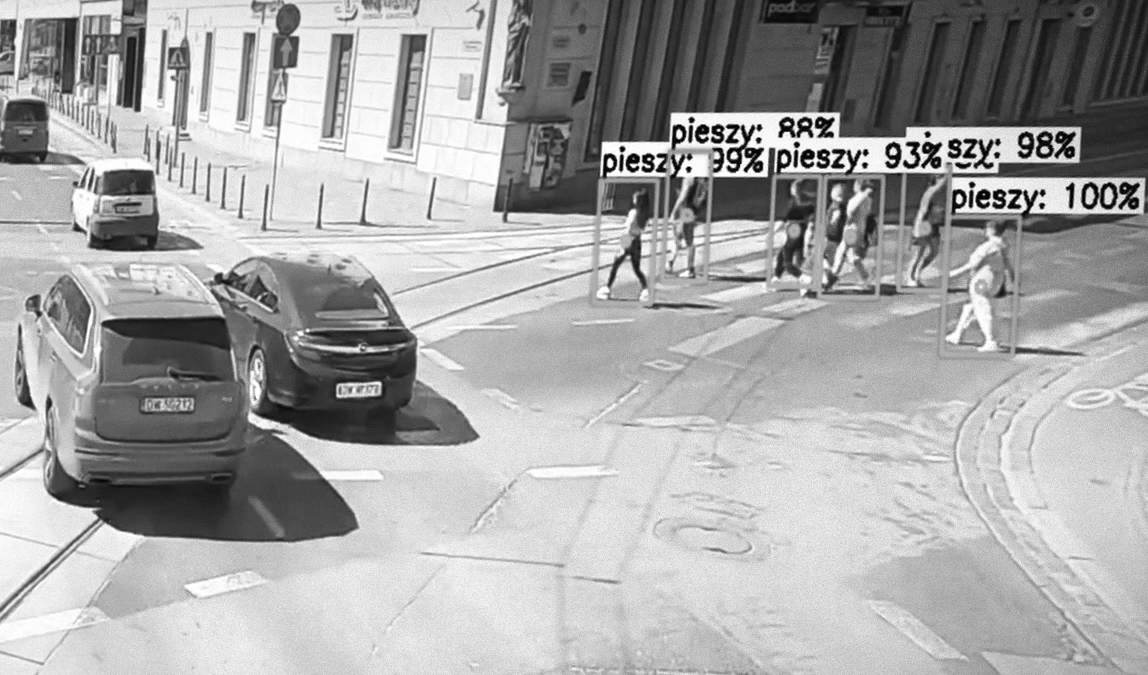
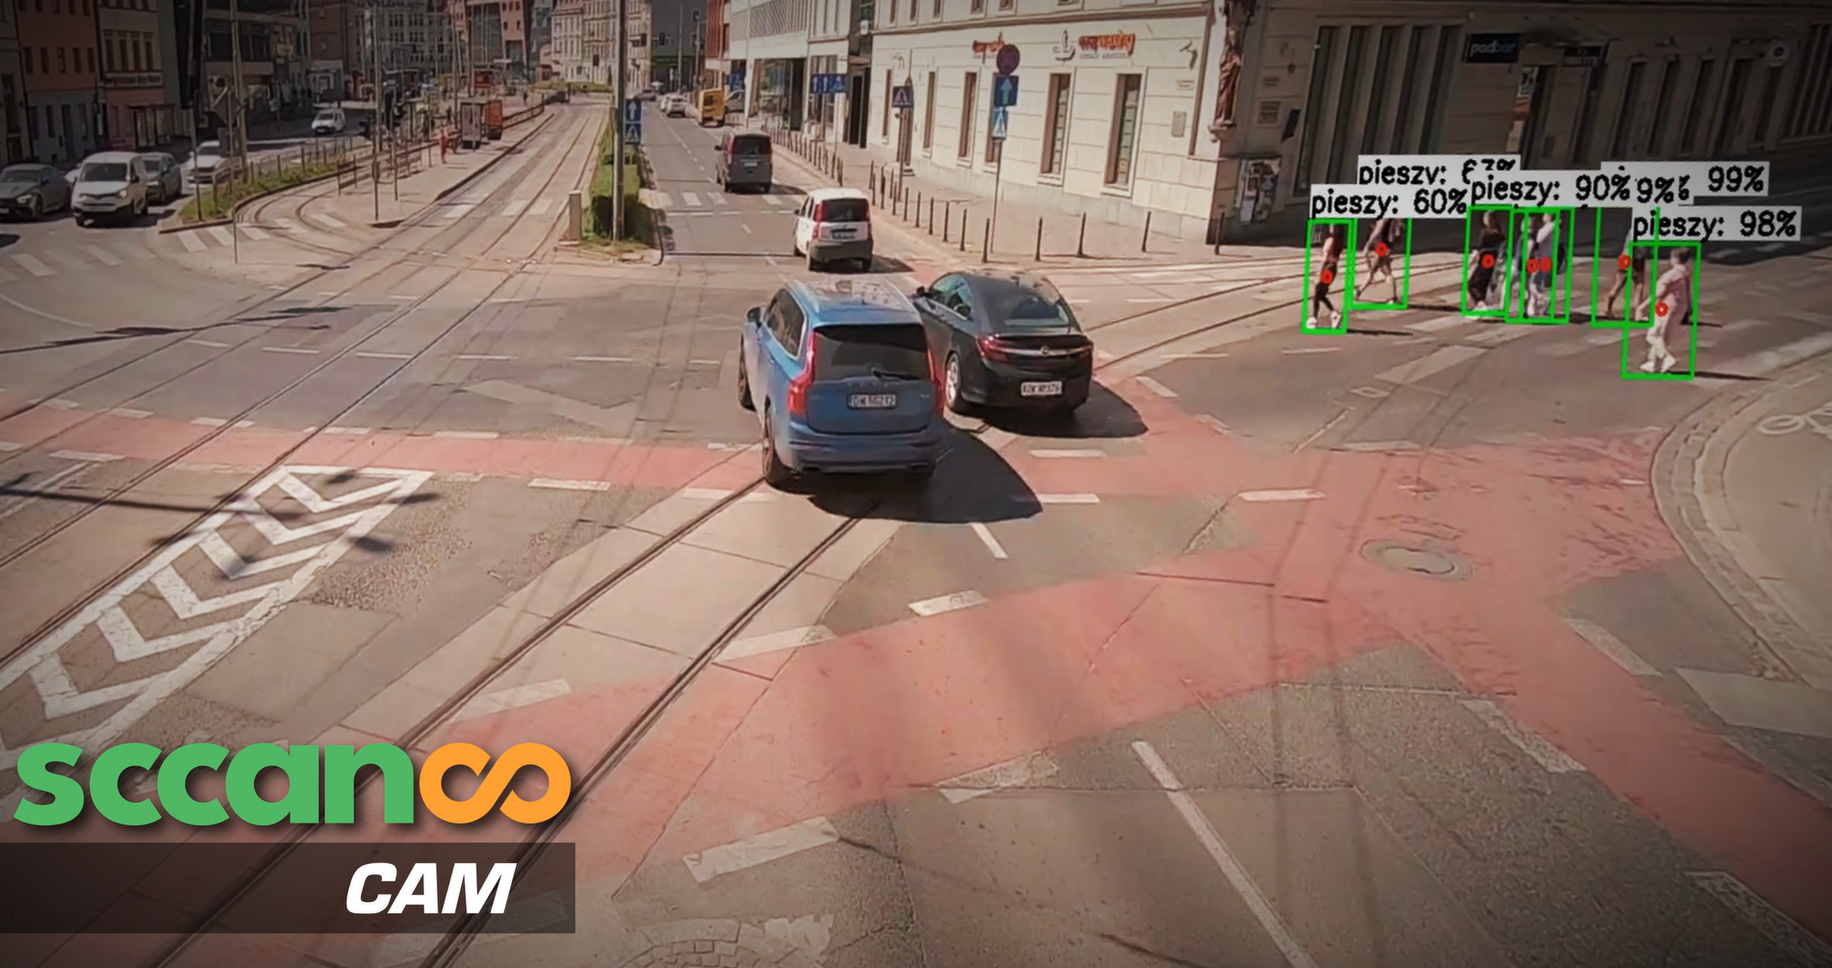
SCCANOO.CAM is an innovative solution based on computer vision and artificial intelligence that provides accurate and versatile counting of pedestrians and cyclists at intersections and other key points.
Why SCCANOO.CAM?
SCCANOO.CAM not only counts pedestrians and cyclists but, thanks to advanced artificial intelligence algorithms, can differentiate between various objects such as scooters, food delivery providers, or cargo bikes. This delivers more detailed statistical data.
Where can SCCANOO.CAM be applied?
SCCANOO.CAM is effective in various locations, particularly at intersections and other high-traffic points where the classification of different objects is essential for analysis.
